
SAA research terminal
Digital Assets Analytics
Digital asset and crypto portfolio risk analytics software.
Examine historical losses, concentration, co-movement and hypothetical changes in portfolio weights. Review each result alongside its data window, method and limitations. Built for asset research and portfolio risk review, not investment advice or order execution.
Overview
Understand the risk behind a portfolio.
SAA Digital Assets Analytics is a web-based research terminal for analysts and teams reviewing digital assets. It combines individual-asset research with saved model portfolios, historical risk measures, stress scenarios and what-if comparisons. It does not select investments or manage client assets.

Historical stress and ecosystem views 2 screens
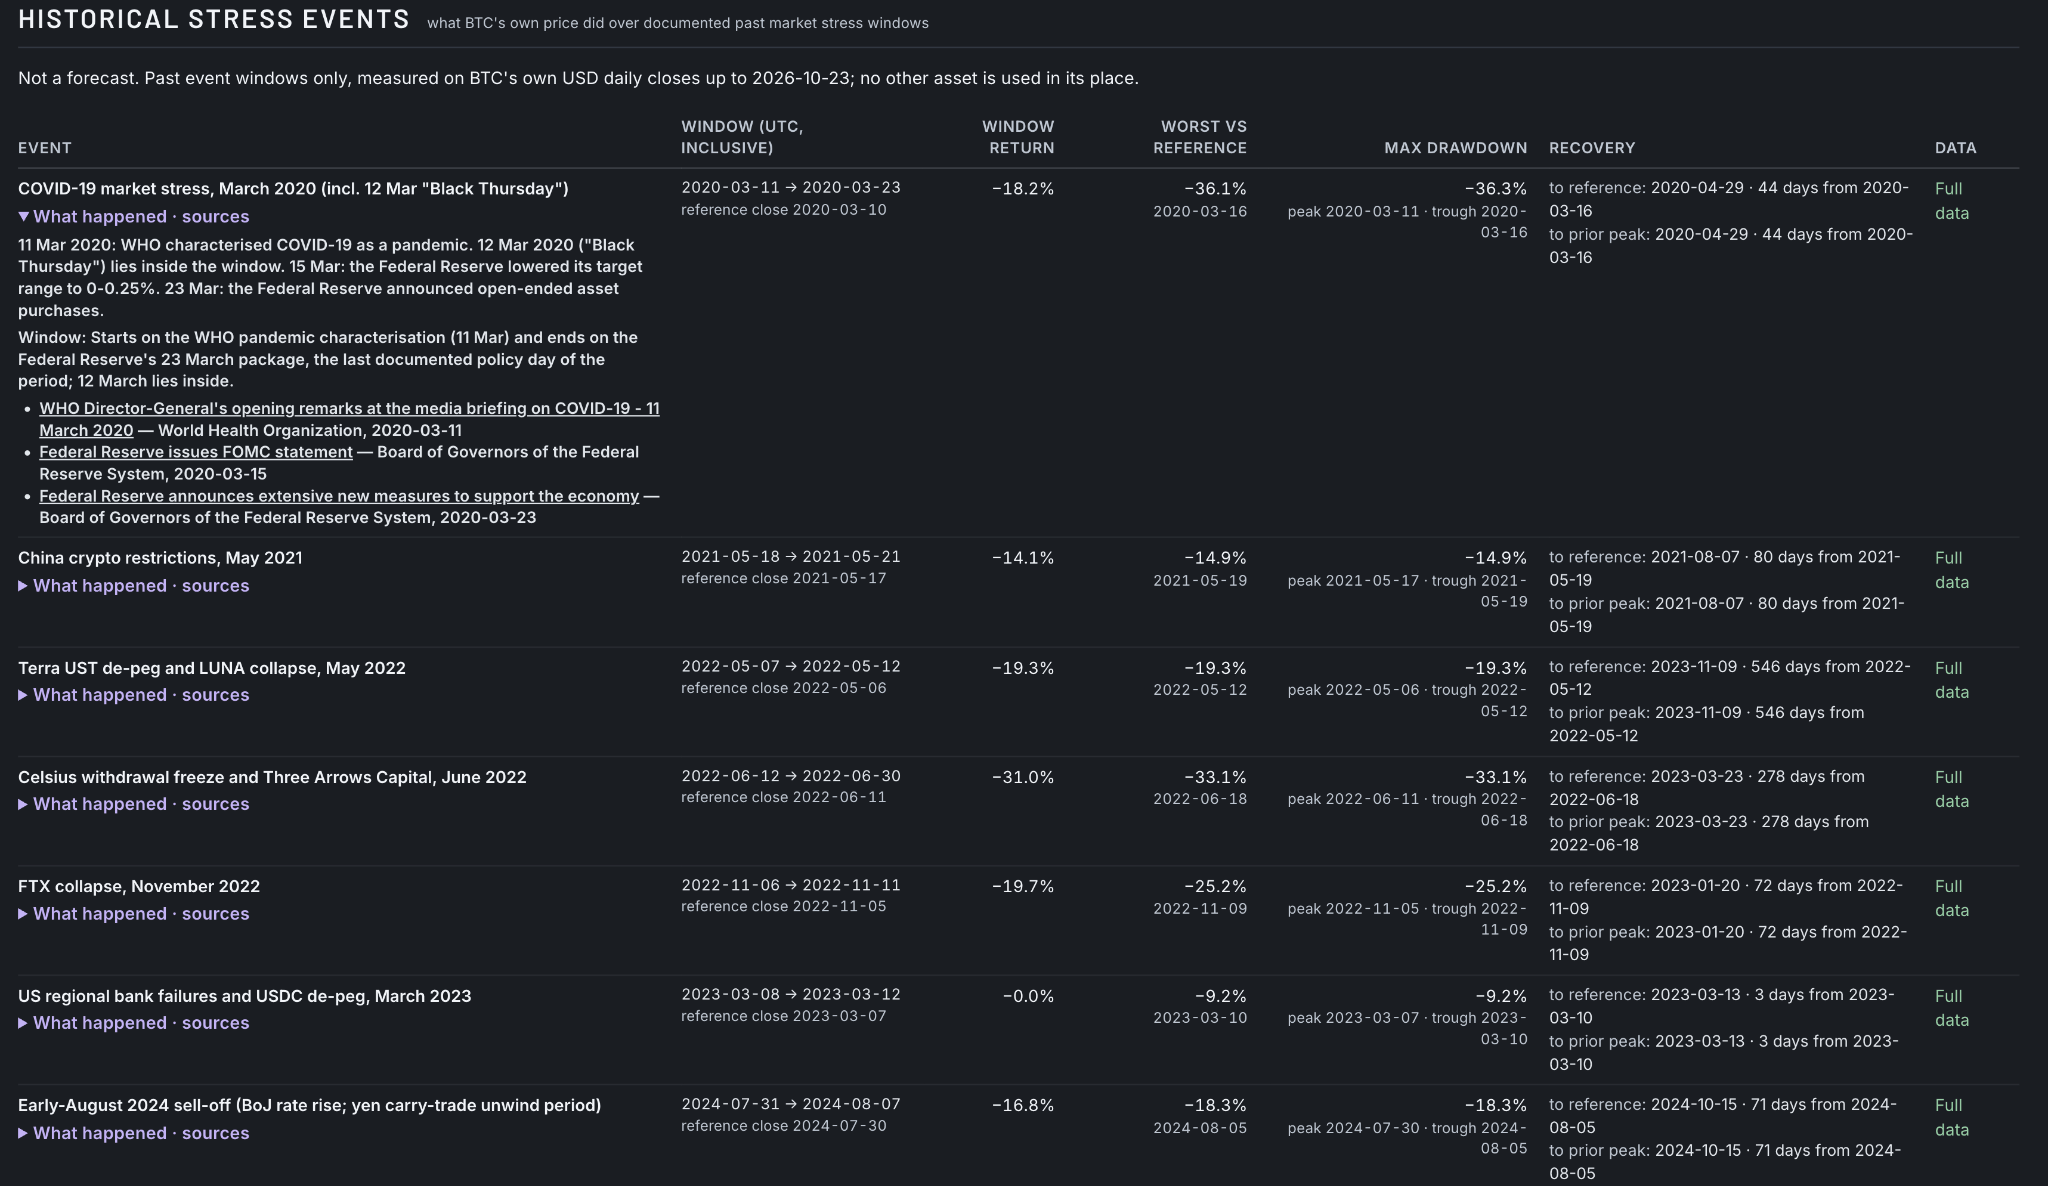

What has the asset experienced?
Read historical volatility, drawdowns, VaR and expected shortfall alongside liquidity context and documented stress events. A past loss estimate is not a forecast or a maximum possible loss.
Where is the risk concentrated?
Compare capital weights with contributions to historical portfolio risk. Inspect co-movement and test hypothetical changes in weights. A smaller percentage loss estimate can still mean more money at risk when the model portfolio grows.
How much does the result establish?
Inspect the sample, observation dates, assumptions and validation status. Missing data and inconclusive tests remain visible. A calculation can be available while its use for risk limits, capital or position sizing is not approved.
Scoring model
Quality, market risk and evidence are different measures.
A quality index describes the measured components of an asset-class framework. Risk State describes current market-risk drivers under the applicable policy. Neither is a recommendation. The terminal discloses the framework and evidence behind the result; an index can be shown without a grade when grade calibration is pending.

Risk Desk overview 1 screen

| Result | What it describes | What it does not establish |
|---|---|---|
| Quality index | A computed index on the scoreable framework components, with nominal and effective weights. | Fair value, a credit rating or expected investment performance. |
| Risk State | A policy-based reading of measured market-risk drivers. | A forecast, an instruction or a declaration that an asset is safe. |
| Evidence coverage | The share of nominal framework weight that can be scored in the run. | The percentage of all risks covered, or the probability that the result is correct. |
| Validation status | What the reported tests establish, reject or leave inconclusive. | Overall model approval merely because one test does not reject. |
A composite requires at least 75% scoreable nominal coverage and the framework’s required evidence. This is separate from the 60% evidence-coverage threshold for asset qualification. Qualification does not guarantee a composite or a calibrated grade. Framework applicability, weights and calibration status must be read for the specific asset and run. Read the Digital Assets methodology ->
Fundamentals
Measured evidence under the applicable asset framework. The illustrated BTC dossier relies on core repository activity over 30 days; this is not a measure of economic value or a complete assessment of token economics.
Network Activity
Network usage: active originating addresses and native economic transfer volume from public explorers. Its measurement contract is being finalised; until it is ratified, both measures are shown as diagnostics and Network Activity is withheld from the composite (the remaining weights renormalise).
Market Quality
Market-liquidity quality: observed depth, spread and modelled market-impact for a $10M reference size. Volatility and drawdown are reported as risk, not scored as quality; BTC correlation and sentiment are shown, not scored.
Security & Resilience
Evidence and limitations depend on the asset class and method version. The illustrated BTC dossier uses legacy audit, bug-bounty and incident evidence; it explicitly does not establish coverage of mining concentration or client dependencies. Token contract scans do not establish network security.
Regulatory Scope
Categorical and evidence-backed: US product-level status, EU MiCA status and direct asset-level sanctions. US and EU are required; without them the category is NOT ASSESSED.
Environmental
Unscored context in the current L1 frameworks, not a consensus-class score. Missing measured energy evidence is not replaced by a favourable assumption. Social and governance are not measured.
The supplied BTC dossier dated Oct 24, 2026 shows an index of 80.9/100 on 78% scoreable nominal weight, partial evidence and no grade issued. This is a dated research example, not a current asset assessment. SAA research indices are not credit ratings.
Capabilities
From asset diagnostics to portfolio scenarios.
Each plan adds a layer: Standard covers single-asset research – View Detailed Analysis, Risk Kernel, Ecosystem Impact, Scenario & Threshold and Generate Institutional Report (5 per month) – plus one portfolio of up to 10 assets with single-asset what-if weight scenarios. Pro adds 5 portfolios of up to 20 assets, multi-asset what-if scenarios and 20 reports per month. Pro+ adds the full SAA universe, unlimited reports, portfolios of up to 30 assets and the Pro+ Workspace. Operator and governance functions are not included.
Asset risk and comparisons
Historical VaR and expected shortfall, volatility, drawdowns and comparison views. Read confidence levels, time windows and sample sizes alongside the figures. Comparisons on different periods are explicitly qualified.
Historical stress and model checks
Asset-specific price history across documented stress windows, with event sources. Tail-risk diagnostics disclose coverage checks, exception counts and inconclusive results. Configured portfolio stress scenarios are separate hypothetical models, not a record of realised losses.
Asset briefs and analytical dossiers
Analysis (Free) and View Detailed Analysis (Standard) bring together key findings, quality components, risk drivers and evidence limitations. Current calculations and saved report figures are identified separately.
Risk and ecosystem diagnostics
Risk Kernel, Ecosystem Impact and Scenario & Threshold are included from Standard. Explore documented structural relationships and price sensitivity. A documented link is not proof of causal dependence or a quantified loss exposure; research sensitivity is not a validated forecast.
Reports
Generate Institutional Report in HTML or PDF: 5 new reports per calendar month (UTC) on Standard, 20 on Pro, unlimited on Pro+. Reopening or downloading a report, or a failed generation, does not count.
Portfolio risk and what-if scenarios
Review historical VaR / ES, capital weights, risk contributions, co-movement and concentration. Compare before-and-after model results under hypothetical weight changes; modelled transition costs are separate from portfolio risk. Standard: 1 portfolio of up to 10 assets and single-asset what-if scenarios. Pro: 5 portfolios of up to 20 assets and multi-asset what-if scenarios. Pro+: unlimited portfolios of up to 30 assets. No transactions, allocation guidance or suitability assessment.
Pro+ Workspace
Scenarios & Stress on a saved portfolio: catalogue stress scenarios, a custom per-position shock, reverse stress, historical replay of current weights and the model NAV distribution – each with its assumptions and limits. Results can be archived and exported. Factor & Dependence and Portfolio What-if are included in Pro+. A review approved by a second person (four-eyes) needs an organization reviewer seat, available by arrangement.
Terminal example
A lower risk percentage can still mean more dollars at risk.
A dated example from the terminal, not a suggested allocation. The model portfolio contains seven assets and a declared value of $1,000,000. The what-if calculation adds $50,000 of model cash to BTC. No money is deposited and no transaction takes place.

Risk contributions, stress and dependence 3 screens


Starting capital weights: BTC 50%; AVAX, ETH, HBAR and LTC 10% each; SOL and XRP 5% each. These are declared model holdings, not verified account balances.
| Measure | Before | After (model) |
|---|---|---|
| Portfolio value (NAV) | $1,000,000.00 | $1,049,949.77 |
| Historical VaR99 · 1 day | $68,943.11 | $71,937.03 |
| VaR99 as a share of NAV | 6.89% | 6.85% |
| Historical ES99 · 1 day | $88,038.33 | $91,865.72 |
| ES99 as a share of NAV | 8.80% | 8.75% |
| Weight concentration (HHI) | 0.2950 | 0.3152 |
Read the amount, percentage and concentration together.
The displayed VaR share falls from 6.89% to 6.85%, while the dollar estimate rises by $2,993.92. Concentration also rises. The increase in NAV comes from added model cash, less $50.23 of modelled transition costs; it is not an investment return.

Scenario inputs and cost basis 2 screens


Basis and limits of this example
The 99% tail contains four observations before and after: estimates are indicative. Calculation completed with limitations; model validation is not established; release is research-only. Risk limits were not checked. These are historical model estimates, not forecasts, maximum possible losses or instructions to change the portfolio.
The cost model in this captured result uses a single Binance spot market-depth snapshot and an assumed fee, not the user’s account tariff or a current executable quote. Holdings are inferred from declared value and weights, not reconciled with an account. The two phases use the same accepted return panel and tail dates; source-to-result reproduction was not independently performed.
Source: terminal Portfolio risk and What-if weight screens captured Oct 24, 2026. Values above are transcribed from those screens, not a new calculation or a live data feed.
Claim boundaries
The score is useful because the boundary is explicit.
All figures are computed from public data sources. Where data is insufficient, a value is withheld as N/A or WITHHELD rather than estimated. Some analytics are review-only diagnostics, not validated forecasts. The platform provides descriptive research only: no trading signals, no allocation or trade guidance, and no suitability assessment.
Not a credit rating.
SAA quality indices are proprietary research measures. A numeric index does not imply a calibrated grade. They are not NRSRO ratings, EU CRA ratings, S&P, Moody’s or Fitch grades.
Public data, explicit gaps.
Third-party feeds may be delayed, incomplete or unavailable. A withheld value is an intentional evidence boundary, not a promise of a complete or validated forecast.
Research, not trading.
SAA is a software provider. We do not hold or transfer client funds, do not execute trades, do not provide investment advice or trading signals, and do not custody digital assets.
Figures, including VaR, liquidity and risk diagnostics, are provided "as is" for research and must not be relied upon as the basis for any financial decision. Crypto-assets are highly volatile; past data and model outputs do not predict future results, and third-party data may be inaccurate or delayed.
Computed does not mean validated.
A completed calculation, an available dataset and a non-rejected statistical test are different from overall model validation. Research-only and inconclusive results must be read with their stated limits; they are not approved for risk limits, capital or position sizing.
Scoped, evidence-backed.
The regulatory category scores US product-level status, EU MiCA and direct asset-level sanctions only; other jurisdictions are context. An asset without an evidence-backed record is NOT ASSESSED, never a favourable default.
Evidence and access
Public research. Explicit access boundaries.
Access the platform at digital-assets.saa-alliance.com. Free analysis is public. Standard, Pro and Pro+ are self-serve monthly subscriptions. Organization arrangements – seats and SSO, contracted capacity, Web3 Treasury, Model Review & Evidence and Derivatives exposure analytics – are provisioned and invoiced by the SAA team. Separate institutional integrations remain subject to an agreed scope.
Free first, then subscribe.
Explore the Analysis page on BTC, ETH, SOL, XRP and LTC without an account. Subscribe to Standard, Pro or Pro+ from the pricing page. Organization arrangements are made with the SAA team; operator functions are not included.
Market data and primary records.
Market data: CoinGecko via a paid API subscription, public derivatives market data (context only), DefiLlama and Alternative.me. On-chain: Blockscout and Etherscan. Security: GoPlus contract scans. Regulatory evidence: SEC EDGAR filings and the ESMA MiCA register.
Reports require usable data.
SAA-qualified assets pass the qualification gate: verified identity, a ratified class framework and at least 60% evidence coverage. Standard covers all SAA Qualified assets plus the free five; 10 is the asset limit within its saved portfolio, not a limit on research coverage. Pro covers up to 100 assets and Pro+ the full SAA universe, including Qualified and analysable assets with partial coverage. Individual metrics and composite scores remain subject to their own evidence rules. Stablecoins are excluded. An asset rejected for insufficient data does not consume a report.
Primary-source evidence.
Regulatory records cite SEC filings and the ESMA MiCA register; every source document is archived with its SHA-256 in a write-once archive and re-checked quarterly.
Plans
Research access, clearly scoped.
Published prices in USD, excluding taxes, as of Oct 12, 2026. Applicable VAT, GST or sales tax is calculated for your country and shown at checkout before payment. Standard, Pro and Pro+ are self-serve monthly subscriptions. Organization arrangements are made with the SAA team. Each plan includes the preceding plan’s features. Stablecoins are excluded from asset coverage; limits are enforced on the server. View pricing ->
$0
Analysis only, on BTC, ETH, SOL, XRP and LTC. No account required. No institutional reports.
Open platform ->$100/month excl. taxes
Single-asset research: View Detailed Analysis, Risk Kernel, Ecosystem Impact, Scenario & Threshold, and 5 institutional reports per month (HTML / PDF). 1 portfolio of up to 10 assets with single-asset what-if risk scenarios. All SAA Qualified assets plus the free five, with no separate cap on qualified-asset research coverage.
Subscribe ->$300/month excl. taxes
Everything in Standard plus 5 portfolios of up to 20 assets, multi-asset what-if scenarios, portfolio risk, co-movement, stress and A/B comparison. 20 reports per month. Up to 100 assets: SAA Qualified and analysable assets with partial coverage.
Subscribe ->$900/month excl. taxes
Everything in Pro plus the full SAA universe, unlimited reports, unlimited portfolios of up to 30 assets and the Pro+ Workspace: Scenarios & Stress, Factor & Dependence and Portfolio What-if.
Subscribe ->By arrangement – Web3 Treasury (for protocols, DAOs and foundations), Model Review & Evidence, Derivatives exposure analytics, and organization seats, SSO and contracted capacity. Contact SAA ->
Operator and governance functions are not included in any plan: Agent & Governance, Alerts, Assistant and Admin remain separate roles.
Product questions
What can you assess with the terminal?
Can I analyse a crypto portfolio rather than only individual assets?
Yes. Saved model portfolios are available from Standard. The terminal includes historical portfolio loss estimates, capital weights, risk contributions and what-if risk scenarios. Portfolio limits and multi-asset capabilities depend on the plan; see Plans.
How do VaR and expected shortfall differ?
Historical VaR describes a loss threshold at the selected confidence level. Expected shortfall (ES, also called CVaR) describes the average loss in the selected historical tail under the disclosed estimator. Both depend on the sample and method; neither is the maximum loss that could occur.
Does a what-if result tell me which assets to hold?
No. It compares model outcomes under a hypothetical change. Read dollar risk, percentage risk, concentration, transition assumptions and data limitations together. It does not assess suitability, recommend weights or place an order.
Can I inspect the evidence behind a result?
The terminal provides method and data views, sample periods and result-specific limitations. Saved reports and current calculations are distinguished. Some results remain partial, indicative, inconclusive or research-only; access to a result does not establish independent validation.
Can I try the terminal before subscribing?
Public Analysis covers BTC, ETH, SOL, XRP and LTC without an account. Saved portfolios and detailed research are paid features. Open the terminal or check current plans.
Access
Start with the asset list you already review.
Explore the Free surface, then subscribe to Standard, Pro or Pro+ from the pricing page. Organization arrangements are made with the SAA team. For cancellation or account questions, contact the team.